
Employee Charge Statistics
The screenshots on this page do not all reflect the new web version yet.
The Employee Charge Statistics report is designed to show employees' chargeable hours, optionally broken down by time, activity, costs, team, office, category, company or case (client).
When this report is created all relevant cost records in Case Manager are reviewed. Costs are identified as:
- Unbilled costs: costs that have not been invoiced
- Billed costs: costs that have been invoiced
- Billable costs: the total of unbilled and billed costs
- Non billable costs: costs that will not be billed
Unlike the accounting reports, the Employee Charge Statistics report can include unbilled and non billable costs, as well as billed costs. Thus, the report has numerous applications beyond the generation of employee statistics.
Note that the report can be filtered by case information, such as the case's team, as well as by cost information, such as the cost's team. Similarly, it can be filtered by the case's Assign To employee, as well as by the employee adding the cost.
Applications
The report has applications such as:
- If you pay your consultants only when a cost is invoiced, the report can display invoiced costs only.
- If you pay your consultants based on the hours they have charged, the report can show the total owed to the employee (their base rate multiplied by chargeable hours) for a certain time period. You can compare this with how much they have earned for the business.

For example the employee above earned the business $1392 ex tax (Y) in the nominated period. As his base rate was $100 per hour (this is set in the Employee List), over the 11.89 hours (X) he worked to earn $1392 for the business, he earned $1189 (Z) for himself.
- More generally, if you want to see cost reports showing more detail than seen above, you can use this report to produce them.
The report output is always divided per employee but there is a second level of subtotalling that you set at the Other options tab (see item labelled T in Run report).
For example, the report fragment shown above was divided per employee and subtotalled by employee. The report fragment below was divided per employee and then subtotalled by case:
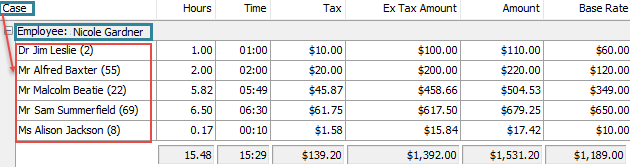
So the Subtotal option at T adds extra case information to the report output. In this example it adds case information.
The output can also be exported to an Excel file, where it can be sorted, formatted and visualised, see Exported data in Excel.
Remember that there are multiple filter levels in this report, as mentioned above. Thus, when you want to report on all the costs added by a certain employee, filter by their name at the costs filter. Make sure that you set the correct filter selection at the case level, because that employee may add costs to a case where they are not the Assign To employee.
Run report
To run the report select View > Reports from the main menu and then click Employee Charge Statistics. See Run Employee Charge Statistics report for details.