
Ad hoc reports
The entire system is designed so that grids can be customised to report on what is most important to you:
- The information in the grid can be filtered, sorted and grouped using the standard list tools.
-
- You can choose the columns to be displayed in the grid.
- At the Case List, extra customisation options are provided by Case List Criteria.
Once information is displayed in a grid to meet your requirements, it can be printed or exported as it is to Microsoft Excel. Further manipulation and visualisation is possible in Excel, see below.
Thus, you can quickly create reports 'on the fly'. We call these ad hoc reports because they are produced as necessary to suit particular purposes.
These ad hoc reports are available wherever grids are present. As an example the list of Tasks can provide ad hoc reports on employee task performance, for example reporting on all overdue tasks in an office, sub totalled by employee.
Such customised results meet many reporting requirements. At the Case List, the customisation specifications (including grid filters) can be saved for later re-use with Saved views.
Export to Excel
After customising the information displayed in the grid, a possible next step is to export this information to an Excel file.
Be aware that there are several system settings that apply here, see Other system options.
Once your data is in Excel, further manipulation can be applied to the data using Excel's formulae (e.g. column totals) and other powerful features.
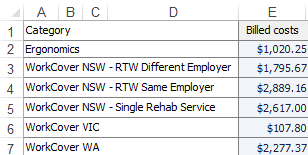
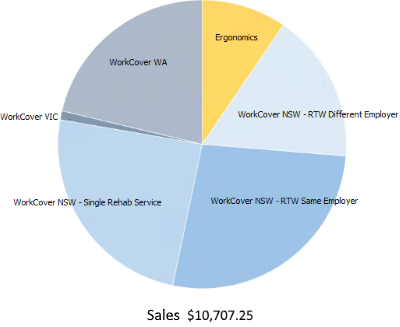
The data can also be visualised using charts and shapes. For example, the Case Manager data exported to Excel below can be expressed as a simple pie chart.
This process can be automated with Excel macros.