Run Employee Charge Statistics report
The screenshots on this page do not all reflect the new web version yet.
The Employee Charge Statistics report is designed to show employees' chargeable hours. It can also be used as customisable cost reporting tool, see Employee Charge Statistics.
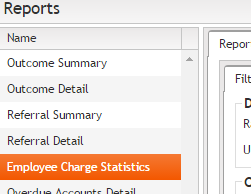
To run the report select View > Reports from the main menu and then click Employee Charge Statistics.
The report works with the entire Case Manager database and its cost records
Each cost record has a date and is linked to a case, to employee(s), usually to one or more companies, and so on. It has a type, a billable status and an invoice status: billed or unbilled. It also has a base rate, which is the number of employee hours involved multiplied by their base rate at the time the cost was created.
The first step is to specify the filter conditions, i.e. exactly which of these cost records you want to display and add up. You first narrow them down by date, company and case. The you further narrow them down by characteristics of the cost.
Lastly you specify options that you want to see in the report.
There are three tabs where you set your requirements:
Filters tab
Click the Filters tab. In this tab you specify filters for date, company and case.
- Select a date range option for the cost records from the Range dropdown list.
- Select whether this date range should be applied to the date of the cost or the date of its invoice (if one exists).
- For company filtering you can choose between
- All companies
- Filter by company on invoice
- Company in role
This is an important choice and is further explained below at Cost date and invoice date.
Don't filter by company
Filters by the company name on the invoice.
Type the company name in the box at the bottom of this section or select from the dropdown list. Note that choosing this option will exclude all unbilled costs because they have not been invoiced.
This allows you to apply a company filter based on the contacts associated with a case. Type the company name in the box at the bottom of this section or select from the dropdown list. You can optionally specify one or more roles to further restrict the filter:
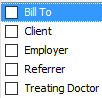
For example, to display costs associated with cases referred by the Acme company, select this option, click Referrer and type Acme in the company filter.
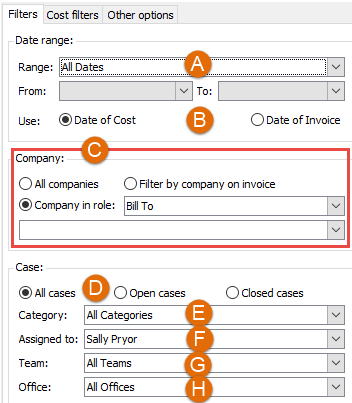
- Choose between costs for all cases, open cases or closed cases.
- Click the Category dropdown list and select one or more case categories.
- Click the Assigned to dropdown list and select cases assigned to one or more employees.
- Click the Team dropdown list and select cases assigned to one or more teams.
- Click the Office dropdown list and select cases assigned to one or more offices.
Cost filters tab
Click the Cost filters tab. In this tab you specify filters for the cost records themselves.
- Click one or more checkboxes to specify which type(s) of costs should be included.
- Click one option to filter the value of the cost: non zero, zero or any.
- Click one option to filter the billable status of the cost.
- Click one option to filter based on the cost's invoice status. Choose between:
- all costs,
- unbilled costs,
- billed costs regardless of whether the invoice has draft or finalised status,
- billed costs with a draft invoice, or
- billed costs with a finalised invoice.
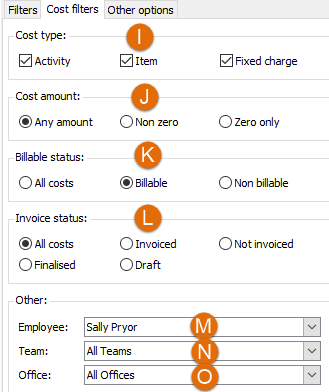
- Click the Employee dropdown list and select costs added by one or more employees.
- Click the Team dropdown list and select one or more cost teams.
- Click the Office dropdown list and select one or more cost offices.
Other options tab
Click the Other options tab. In this tab you specify what should be displayed in the report.
- Click the checkbox to show columns with time as a decimal value in the preview or print outputs.
- Click the checkbox to show columns with time as hours and minutes in the preview or print outputs.
- Click the checkbox to show columns with the amount charged in the preview or print outputs
- Click the checkbox to show columns with the base cost (employee base rate, which is set at the Employee List, multiplied by time worked) in the preview or print outputs.
- Select an option from the dropdown list to specify on what basis the report data should be subtotalled.
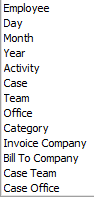
Report data is first divided at the employee level. The value that you specify here is the secondary level of information and organisation in the report. If organisation of the data per employee is not desired at all, the report can be exported to a spreadsheet and then re-ordered as required.
Examples of this option are shown at the top of this page.
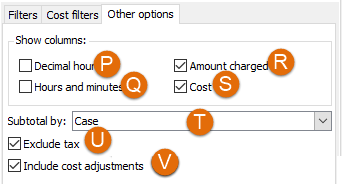
- Click the checkbox to exclude tax from the cost amount displayed in the preview or print outputs.
- Click the checkbox to include a cost adjustments column in the preview or print outputs.
Report output options
Report data can be output to a number of formats. You can choose:
- Preview
Click Preview at the bottom of the screen to open a new browser window where the report data is displayed using a standard template. The information you selected at the checkboxes in the Other options tab is displayed.
The screen offers options to save or export the report in various formats including an Excel file and a comma separated list.
Click Get PDF at the bottom of the screen to convert the report seen in the Preview option above to a PDF file which is immediately downloaded.
General notes
When reporting employee statistics:
- At Filters select cases where the Assigned to is All Employees because there may be costs that an employee has billed to cases where s/he is not the Assigned to employee for the case.
- Similarly be aware that a cost can be billed by a different office or team, for example when someone is doing work on a case for a different office or team.
- Display both billable and non billable costs.
- To produce the same data as the Time sheet, you need to select cases at the Filter tab where the Assigned to is All Employees and ensure that only billable costs are selected at the Cost filters tab.
Cost date and invoice date
It is important to be clear about the difference between selecting between the cost date and the invoice date when filtering costs by date. This is best explained with simple examples.
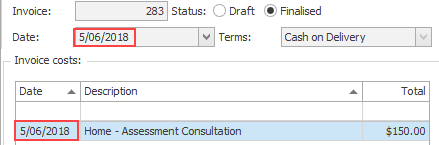
For the first invoice, the invoiced costs report results for June 2018 would be $150, regardless of which date (cost or invoice) was selected. That's because both the invoice and the cost were created in June 2018.
However, for the invoice below, the invoiced costs report results for June 2018 would be different for each option.
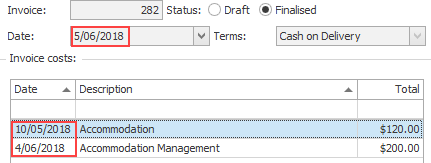
If invoice date was selected the result is 120 + 200 = $320.
If cost date was selected the result is only $200. The $120 Accommodation cost was added in May and would not be included.
This difference means that if you want to compare the results of the Sales Summary report with the Employee Charge Statistics report you should select the invoice date.
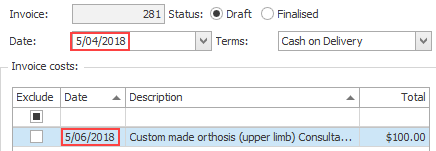
Note also that counter intuitive invoices like the example below may account for comparison discrepancies when the cost date is used. Here the invoice date had been set to earlier than the cost date.